Understanding your Cloud Server management panel
Whenever you purchase a new Cloud Server it will be displayed on the Cloud Server dashboard
Once you select your Cloud Server you will be presented with these sections on Your Active Products/Services:
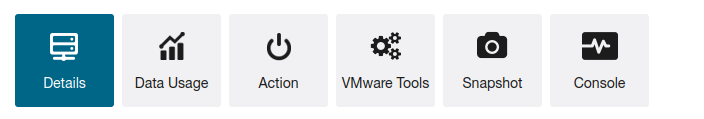
Details- general information about your Cloud Server, like its status, Cloud Server IP, uptime, location, and so on
Details
The Details page consists of several sections:
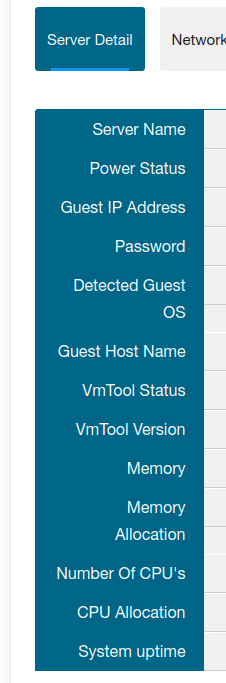
Server Details
This is the first section you see after selecting your Cloud Server. Here you can see your Cloud Server IP, server status, uptime, current OS, location, and node:
This is a section where you can find all the information for connecting to your Cloud Server via SSH:
-
IP
-
DNS
-
Gateway
-
Netmask
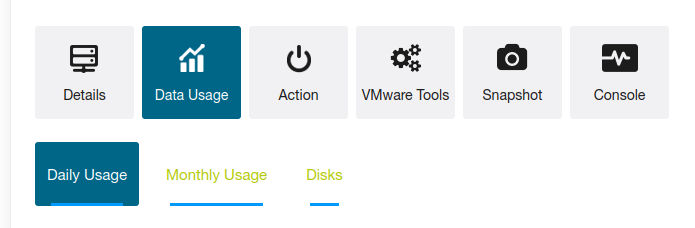
Data usage
Here you will find information about daily, monthly and disk usage data:
In this section you can do everything related to your action from: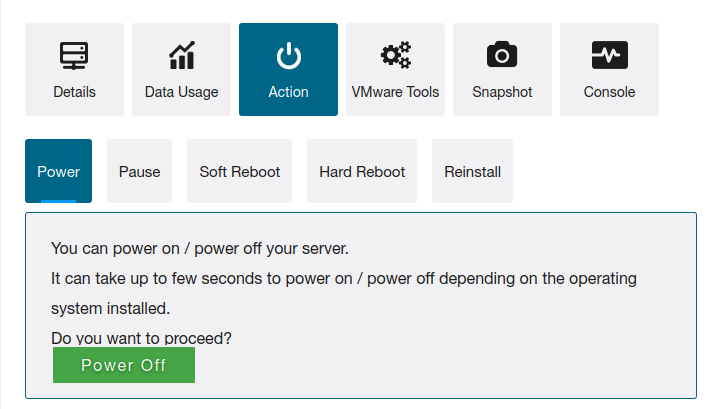
Power: You can power on / power off your server.
Pause: You can paused / unpaused your server.
Soft Reboot: This will reboot your server.
Hard Reboot: This will reboot your server ---->> Do not use this action, as it may lead to problems with the data base
Reinstall: In case, if your system has been crashed. You can re-install your server.
This will re-install your server.
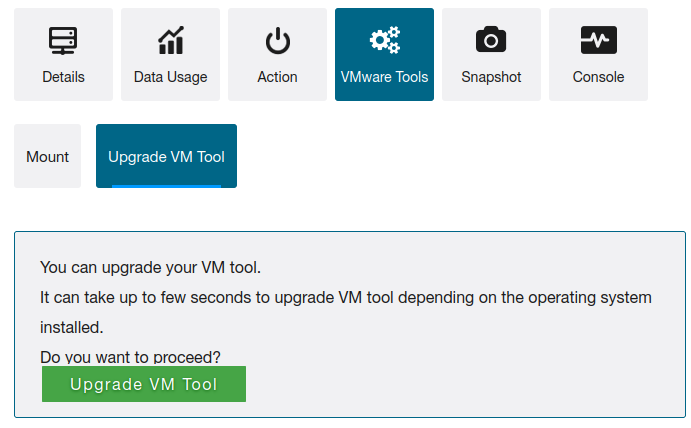
VMware Tools
In this section, you can create an upgrade for VMTool and Mount for your server:
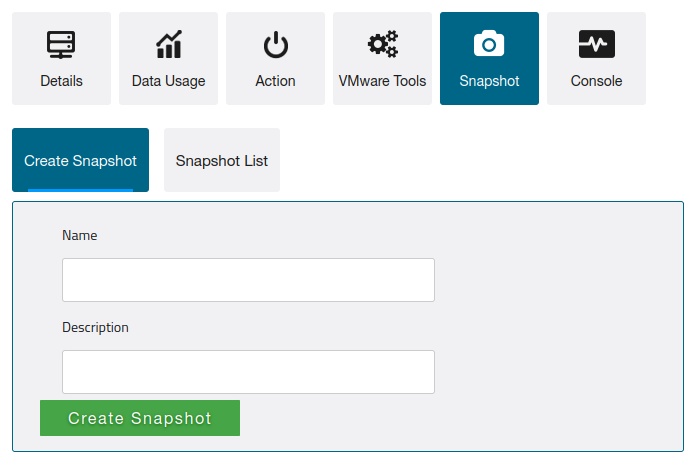
Snapshot
In this section, you can make a backup and restore through Snapshot:
Console


